Price & Portfolio Strategy Simulator (P&POSS)
Maximize your market share by building a data-driven pricing strategy for your portfolio of products, services or solutions.
Evaluate different competitive market scenarios through a preference share simulator and identify the optimal configuration of up to 150 SKUs, taking into account variables such as format, price and cannibalization.

- Indicators included
- 30
- Analysis blocks
- 6
- Add-on modules
- 3
- Depth
- Detailed
What does it solve?
- Validate the right configuration for your portfolio
- Find the price points that differentiate you in the market
- Learn your product's ideal configuration versus competitors
- Maximize profits through better pricing
- Increase new product success by setting the right price
- Build holistic portfolio and pricing strategies
- Assess the financial viability of new products before launch
Who is this study for?
What's included?
The analyses and indicators delivered in your report.
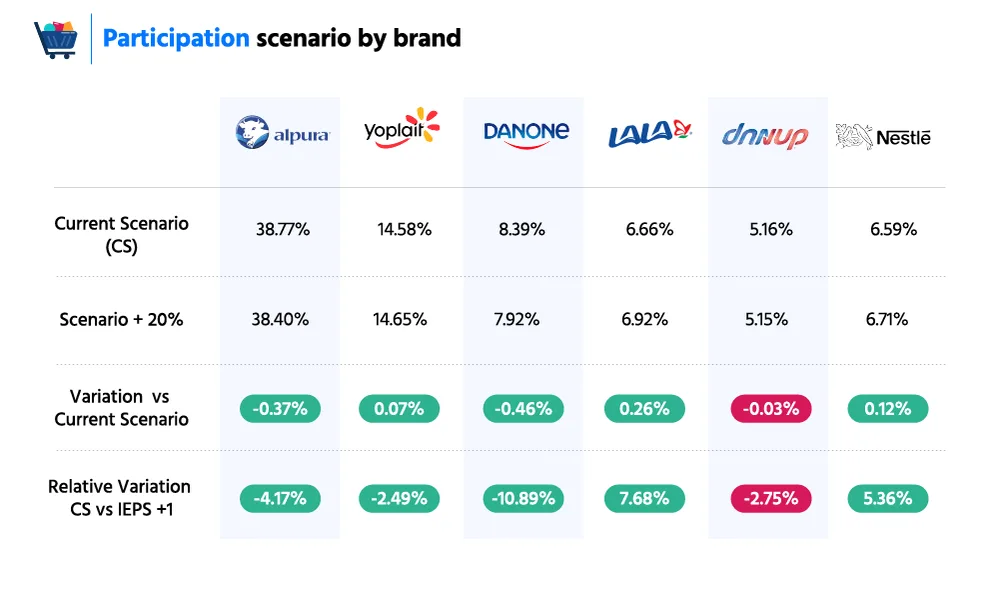
01Market preference analysis
- Preference share of the current scenario
- By brand
- By SKU
- By subcategory
- By special grouping
- Absolute variation vs. the current scenario
- Relative variation vs. the current scenario
- Business group
- Product brand
02Share scenarios
- Share by format and variation vs. current scenario
- Share by product line and variation vs. current scenario
- Share by brand and variation vs. current scenario
- Share by SKU and variation vs. current scenario
- Share by demographic segmentation
- Share by purchase channel and variation vs. current scenario
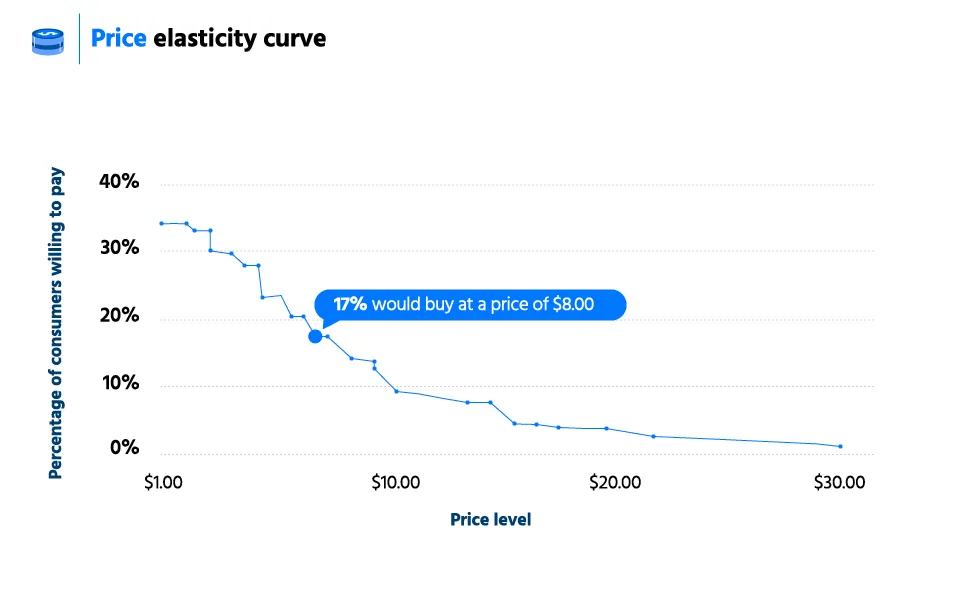
03Price sensitivity by SKU
- Price elasticity curves (client's SKUs only)
- Revenue maximization point
04Price Sensitivity Innovation
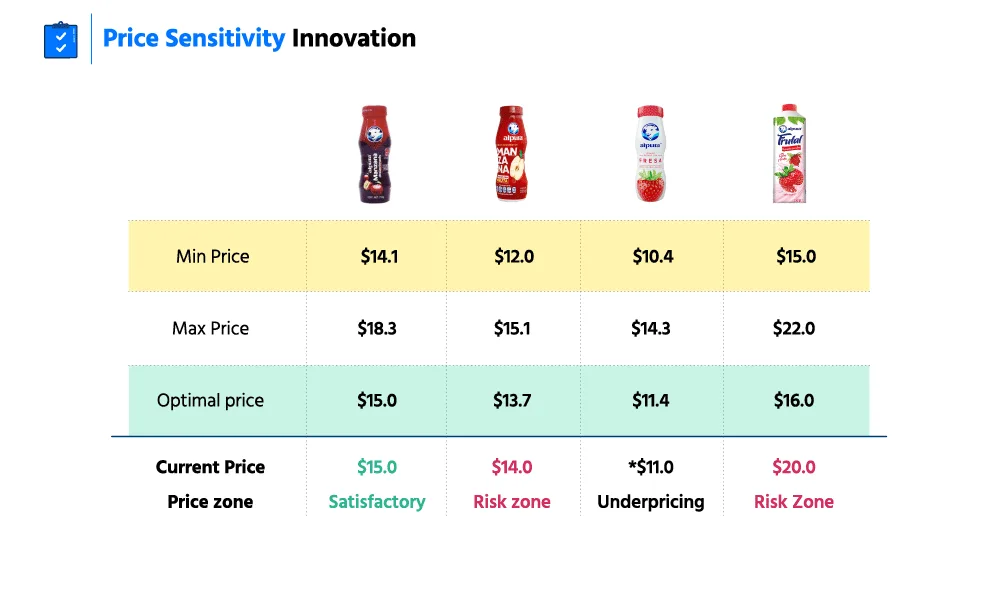
- Minimum price point per SKU
- Maximum price point per SKU
- Optimal price point per SKU
- Launch price point acceptance
- Comparative Risk Price Analysis (CRPA)
05InnoSOV
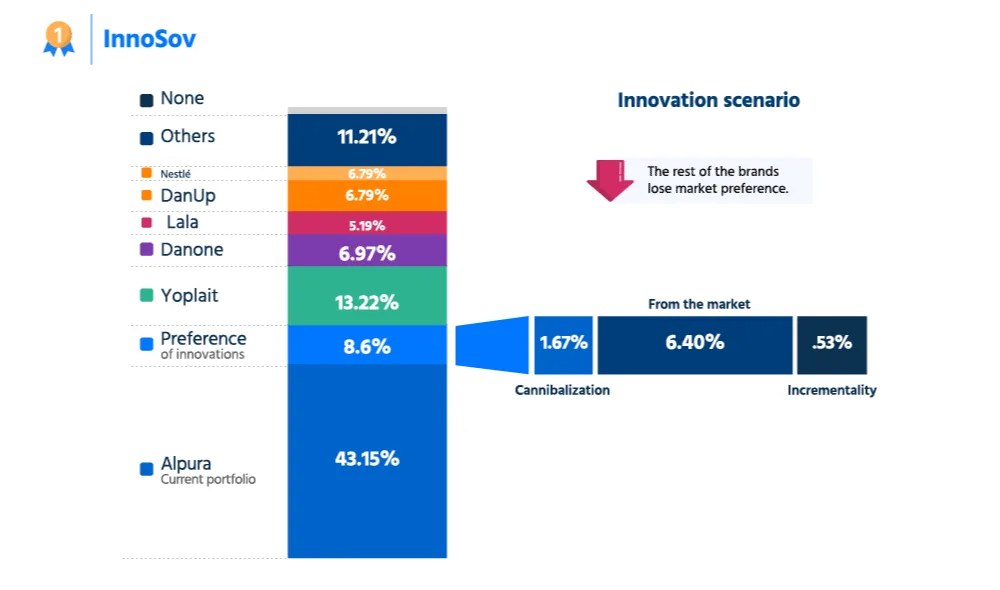
- Cannibalization across the company's brands
- Brand incrementality
- Volume coming from the category
06Preference share simulator
Generate different scenarios and filter the information according to your needs.
- Filter by age range
- Filter by gender
- Filter by region
- Filter by socioeconomic level
- Filter by brand buyers and non-buyers
Add-on modules
Extend your study with these optional modules.
Innovation Deep Evaluation
Learn how well your product could be accepted by evaluating key variables before launch, such as relevance, trial, appeal and innovation.
Additional scenarios pack
A pack of 5 simulations or scenarios to validate your market hypotheses.
Additional elasticity curves pack
A pack of 5 demand elasticity curve analyses for 5 additional SKUs.
Methodology
Atlantia's methodology incorporates multinomial logistic regression techniques to obtain the product combinations and price points preferred by the market. The information is also processed with Conjoint Analysis, an advanced statistical method that identifies the absolute and relative variations caused by changes in your competitors' price points.
We also set up a Market Share Simulator (product vs. product), a tool at your disposal to calculate a product's market share compared with competing products.
Want to apply Price & Portfolio Strategy Simulator (P&POSS) to your brand?
Talk to our team and let's design the study you need together.
Frequently asked questions
What is Price & Portfolio Strategy Simulator (P&POSS)?
Maximize your market share by building a data-driven pricing strategy for your portfolio of products, services or solutions. Evaluate different competitive market scenarios through a preference share simulator and identify the optimal configuration of up to 150 SKUs, taking into account variables such as format, price and cannibalization.
What does Price & Portfolio Strategy Simulator (P&POSS) solve?
Validate the right configuration for your portfolio. Find the price points that differentiate you in the market. Learn your product's ideal configuration versus competitors. Maximize profits through better pricing. Increase new product success by setting the right price. Build holistic portfolio and pricing strategies. Assess the financial viability of new products before launch.
What does the Price & Portfolio Strategy Simulator (P&POSS) study include?
It includes Market preference analysis, Share scenarios, Price sensitivity by SKU, Price Sensitivity Innovation, InnoSOV and Preference share simulator. You can also add optional modules: Innovation Deep Evaluation, Additional scenarios pack and Additional elasticity curves pack.
What methodology does Price & Portfolio Strategy Simulator (P&POSS) use?
Atlantia's methodology incorporates multinomial logistic regression techniques to obtain the product combinations and price points preferred by the market. The information is also processed with Conjoint Analysis, an advanced statistical method that identifies the absolute and relative variations caused by changes in your competitors' price points. We also set up a Market Share Simulator (product vs. product), a tool at your disposal to calculate a product's market share compared with competing products.
Who is Price & Portfolio Strategy Simulator (P&POSS) for?
It is designed for Market research, Consumer Insights, Revenue management, Finance, Trade marketing, Commercial teams and Innovation teams.
Other solutions you may like

Packaging Test
Find the packaging design with the greatest potential for success: Atlantia Packaging Score, heatmaps, brand fit, price sensitivity and shelf standout.
View solution →
Innovation Pipeline Analysis & Simulation (IPAS)
Choose the innovations with the highest potential: evaluate concepts against competitors and consumer preferences, and simulate their share and cannibalization.
View solution →
Innovative Product Ideas Test (IPIT)
Test all your product ideas with a Choice Based methodology and identify the winning concepts by appeal, trial intent, innovation and brand fit.
View solution →